Ever wonder how a tiny number can change your coffee game? A simple reading called TDS tells you if your brew has the right balance of flavors. TDS stands for Total Dissolved Solids, which is just a fancy way of saying how much tasty stuff is in your cup.
When you track TDS and extraction percentage in real time, it's like getting a little nudge when your coffee is off. In other words, these numbers help you spot when your coffee could be even better.
In this post, we're diving into how using these digital cues can take your daily cup from a good brew to a great one. Enjoy the journey to better coffee!
How Digital Metrics Define Coffee Extraction Performance
The SmartRef Digital Refractometer shows you the total dissolved solids, or TDS, in your coffee. In simple terms, it tells you how much of the coffee bean actually went into your cup. Only about 30% of the bean dissolves during brewing, while the rest is made up of fibers and carbs. That little number really helps you know if your coffee flavors are balanced just right.
When you brew your coffee, focus on two main numbers: TDS and extraction percentage. Dark roasts often come in around 1.5% TDS, while lighter roasts tend to be closer to 1.2%. Each stage of extraction gives out different flavor notes. First, you get the sour and fruity hints, kind of like the opening act, then the smooth oils and sugars, and finally, the bitter notes that complete the picture.
Being able to see these numbers in real time is pretty cool. It’s like getting instant feedback on whether you need to change the grind size or adjust the brew time. And with good calibration routines, you know your refractometer is giving you reliable readings every single time. This kind of insight is what helps you taste and fine-tune your coffee until it’s just right.
Key points to remember:
- TDS directly measures the coffee solubles in your cup.
- The extraction percentage helps you get the flavor balance right.
- Real-time metrics and regular calibration keep every cup delicious.
| Metric | Value |
|---|---|
| TDS (light roast) | ~1.2% |
| TDS (dark roast) | ~1.5% |
Sensor-Based Data Collection for Coffee Extraction Metrics
To get accurate TDS readings, cleaning your sensors, like the SmartRef, is a must. Think of it like a chef wiping down a cutting board before preparing fresh ingredients. Each sensor, whether it's a refractometer, pressure sensor, temperature sensor, or flow sensor, captures a unique part of the brew process.
Where you put your sensors really matters. For example, a sensor placed right after the group head will read your brew differently than one in an external flow cell. With IoT-enabled modules, you can log these numbers remotely and see live data from anywhere in your system. Pressure profiling sensors, for instance, measure extraction pressure curves with a 0.1 bar resolution so you can catch even the smallest changes that might affect flavor.
Digital calibration keeps your espresso process running smoothly. Regular cleaning paired with routine calibration ensures every shot is measured just right. Using temperature and flow data makes it easy to fine-tune the extraction process and keep your cups consistent.
For more tips, check out "optimizing sensor accuracy for consistent coffee extraction" (https://aboutjoe.com?p=110) and learn more about pressure sensor details at "interpreting espresso pressure profile data for flavor consistency" (https://aboutjoe.com?p=175).
Core KPIs for Digital Coffee Extraction Analysis
When testing your brew, we focus on the extraction percentage, usually between 18 and 22 percent, paired with TDS readings, which show around 1.2 percent for light roasts and 1.5 percent for dark roasts. This mix of data helps balance out sour, sweet, and bitter flavors. Plus, using sensors to check these numbers makes fine-tuning a breeze.
We’ve also added new measurements, like brew yield (how many grams you get) and brew time (in seconds). For example, imagine a brew that pulls 52 grams in 28 seconds with steady heat, it really brings out that smooth, balanced flavor.
Thermal sensors play a key role too. They check that heat is spread evenly across the group head within a margin of plus or minus 0.5 degrees Celsius. In short, by combining extraction percentage, TDS, brew yield, brew time, and stable temperature, we can consistently judge how well your coffee performs.
The main numbers to watch are:
- Extraction percentage
- TDS levels
- Brew yield and brew time
- Temperature stability (within ±0.5 °C)
| Metric | Target/Measurement |
|---|---|
| Extraction Percentage | 18–22% |
| TDS | Light: ~1.2% | Dark: ~1.5% |
| Brew Yield & Time | Grams & seconds |
| Temperature Stability | ±0.5 °C |
Data Analysis and Algorithmic Optimization of Coffee Extraction
Our digital process mixes smart number-crunching with machine learning to perfect every shot. We check more than 50 coffee samples to catch even tiny shifts in strength (TDS) and yield early on. When little changes pop up, our system gives that shot a score between 0 and 100. Think of it like your brew getting an 85, it’s almost that perfect cup, while a lower score hints that a tweak might be in order.
Simple linear regression helps us see how changing the grind size affects the yield. Imagine nudging the grind just a bit and watching the numbers adjust. And our machine learning tool acts like a wise friend, predicting the best extraction time within about 2 seconds. This means you get a friendly recommendation on how long to brew for that spot-on espresso.
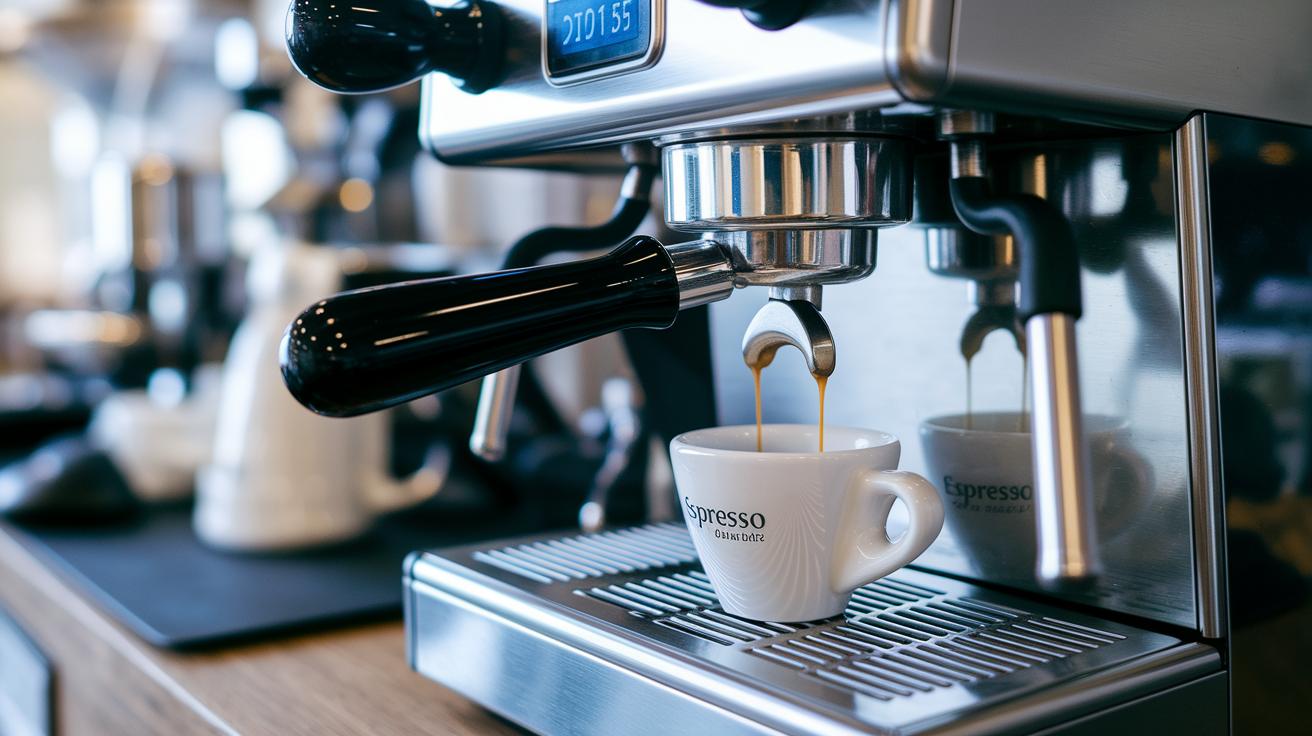
Real-time dashboards share key details, like TDS, pressure, and temperature, as they happen. These visuals aren’t just numbers; they make it easy to spot any sensor drift instantly. So if the TDS starts to wander off its target, the dashboard flags it right away, letting you fix things quickly.
By tracking each shot with algorithmic scores and smart data analysis, we turn every espresso into a measure of quality. Our sensor data checks every little detail so that you can make adjustments on the fly. With every bit of data logged, you’re one step closer to brewing that perfect cup.
Standardization and Benchmarking of Digital Coffee Extraction Processes
To create a reliable scoring system for your coffee extraction, you start by setting up standard curves. Picture a simple graph where the horizontal line shows time and the vertical line shows TDS levels (a measure of how much coffee has been dissolved) for each roast. This lets you easily compare different shots and see if a light roast behaves differently from a dark roast.
Another key step is regular calibration. By cleaning your refractometer’s prisms and the filters in your pressure cell on a set schedule, you can reduce measurement errors by around 0.1% TDS. It’s a bit like keeping your coffee maker clean so that every brew tastes just as it should. Following standard protocols, like checking calibration every 5 hours, helps keep your readings steady.
If you want to compare different machines or setups, try collecting benchmark datasets. For example, gathering data from 30 shots on each machine gives you a strong baseline to notice any changes when you adjust your process. This consistent mapping turns random sips into a repeatable science.
Set your process up like this:
- Create standard curves that track TDS over time for each roast.
- Follow a consistent cleaning and calibration routine.
- Build benchmark datasets to compare across machines.
These steps transform everyday brewing into a precise display of data, turning every cup into a small study of digital performance.
Case Study in Digital Extraction Performance Optimization for Espresso
A specialty café decided to install a smart system that checked every part of making espresso. They set up sensors to log TDS (that’s Total Dissolved Solids), monitor pressure changes, and track temperature on 10 machines so they could keep a careful eye on the brewing process. They even added a smart coffee brewing system (you can learn more about it at aboutjoe.com?p=85) that gathered live data on every shot, making it easy to catch any changes right away.
Over the first eight weeks, their new digital method produced awesome results. The variability in extraction dropped from about ±2% to just ±0.5%. This tighter range meant that each shot came out much more consistent in flavor. Plus, the average TDS went up from 1.25% to 1.35%, showing that more of the coffee’s tasty compounds were being extracted for a richer, more balanced taste.
They also used data to really understand the brewing process. With predictive analytics guiding them, the team made tiny tweaks, like changing the grind size by 25 microns (that’s a very small adjustment to how finely the coffee is ground). These little changes cut the shot time by 3 seconds and improved the overall extraction. Real-time monitoring of key indicators even let the system flag any off shots right away, so the baristas could jump in quickly to keep every cup top-notch.
By continuously logging all the details, the café built up a helpful record that made it easy to fine-tune their process. Each shot even earned a performance score, proving that smart, automated monitoring can turn espresso extraction into a predictable and artful craft.
Final Words
In the action, accurate sensors capture every detail, from TDS readings to extraction percentages, to fine-tune each brew. Digital tools guide sensor calibration and algorithmic adjustments, ensuring every shot meets the flavor target. Small steps like regular calibration and data analysis make a big difference in achieving consistency and taste. Smart technology transforms routine brewing into a precise art. Keep evaluating digital performance metrics in coffee extraction to savor that perfect cup, one delightful step at a time.
FAQ
What does evaluating digital performance metrics in coffee extraction PPT and PDF mean?
Evaluating digital performance metrics in coffee extraction PPT and PDF means looking at key numbers like total dissolved solids (TDS) and extraction percentages. These figures help track brew consistency and guide quick sensor adjustments for an ideal cup.