Have you ever wondered if your coffee could taste even better? Imagine each cup sharing little hints to help you perfect the next brew. Right after brewing, you get simple numbers like TDS (that’s the total dissolved solids, which tell you how much of your coffee’s flavor is in your cup) and extraction yield, which shows how well your coffee’s good stuff is released. By checking these numbers, you can easily tweak things like your grind size or brew time. Every cup becomes a fun chance to fine-tune your method and make your daily brew just a bit more amazing.
Implementing Post-Brew Data Analysis for Continuous Coffee Improvement
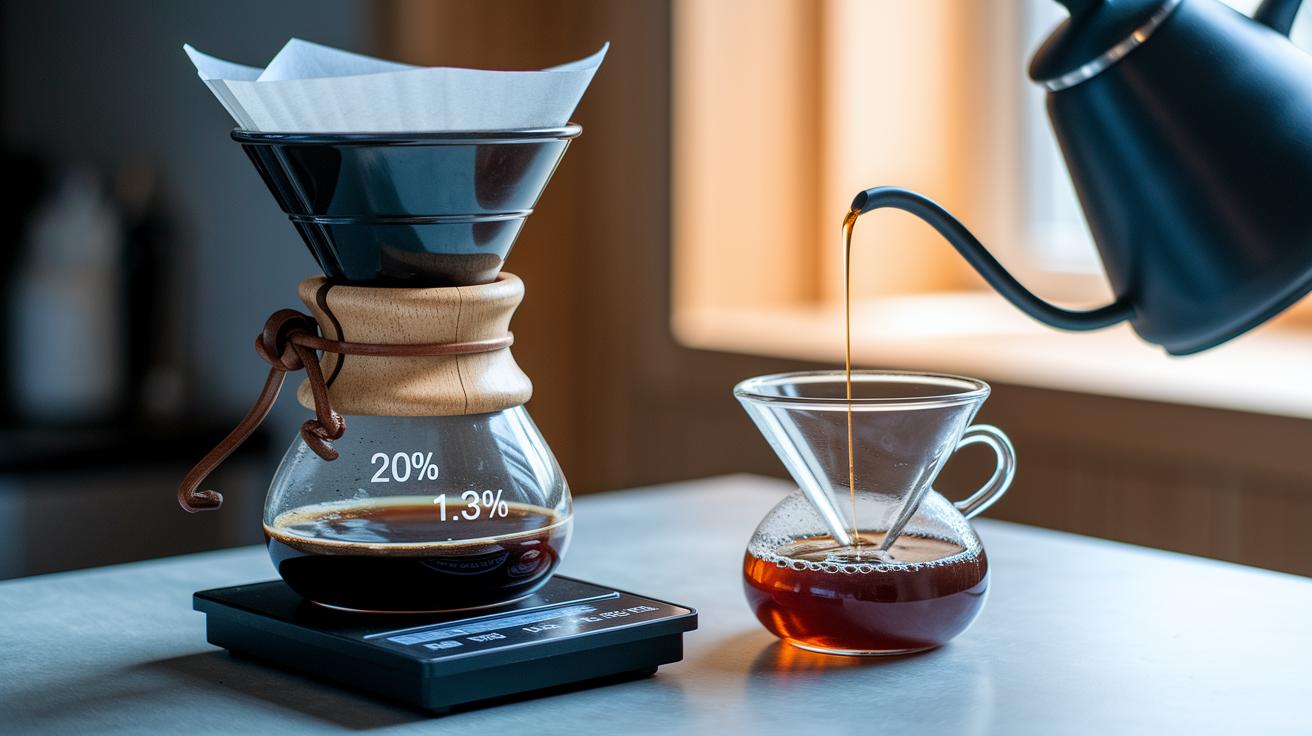
After you brew your coffee, the numbers tell a story. Right when your cup is ready, it’s smart to check key details that show if your extraction went perfectly or if little tweaks are needed. Think of it like savoring that first sip; a quick look at things like TDS levels, basically the amount of dissolved solids in your coffee, can reveal a lot about your brew.
It all comes down to a few main figures. You want to see numbers like total dissolved solids (that’s the good stuff mixed into your cup), extraction yield (how much flavor you’ve pulled out of the grounds), flow rate, brew time, and temperature. Take BrewCat as an example, it logs everything from how coarse your grind is to the water’s heat. By comparing these figures to your ideal targets (say, TDS between 1.25% and 1.35% for filter coffee, and an extraction yield in the 18% to 22% range), you can fine-tune your process cup after cup.
What’s really neat is how AI-driven feedback steps in. It reviews your past brews alongside proven standards and might suggest tiny changes, like adjusting the water temperature or tweaking your grind consistency. It feels almost like having a smart friend guide you through perfecting your brew.
Here’s a simple plan to weave this into your routine:
- Right after brewing, jot down the important numbers.
- Compare these details to your target ranges.
- Try out the small tweaks the AI suggests.
- Watch how your future brews improve with each little adjustment.
Key Brewing Performance Metrics in Post-Brew Analysis
Extraction yield and TDS are the heart of your brewing process. Extraction yield shows how much of your coffee’s flavor gets into the cup compared to the amount of coffee used – a good target is between 18% and 22%. TDS, which stands for Total Dissolved Solids, tells you how strong your brew is and should sit around 1.25% to 1.35% for filter coffees. If your numbers stray outside these ranges, you might want to adjust your grind or brew time.
Flow rate and water temperature also play a big part in the magic of a good cup of coffee. Flow rate, measured in mL per second, shows how evenly the water passes through the grounds and extracts the flavor. A small change in flow can make a noticeable difference in how rich your cup tastes. Meanwhile, even a 1°C change in water temperature can either sharpen or mellow the flavor. This slight tweak might be what you need for a crisper taste.
A recent study found that even tiny changes can transform your brew. In one test, a small decrease in flow rate combined with a 1°C uptick in temperature led to a 10% change in acidity, creating a beautiful balance between sweetness and tartness. Sometimes, a modest tweak in flow and temperature can turn a flat cup into one bursting with vibrant high notes.
| Metric | Target/Range | Impact |
|---|---|---|
| Extraction Yield | 18%–22% | Shows how well flavors are extracted |
| TDS | 1.25%–1.35% | Indicates the strength and balance of the brew |
| Flow Rate | Measured in mL/sec | Affects how evenly the water extracts flavor |
| Water Temperature | Precise control ±1°C | Impacts the speed and nuance of flavor extraction |
Effective Data Collection and Sensor Calibration for Post-Brew Insights
Getting great brew results starts with smart sensor placement and clear data logs. Start by positioning your sensors in spots that truly capture the brew’s temperature and flow, like catching the rich aroma of freshly brewed coffee. It’s helpful to add a timestamp to every reading, much like BrewCat does, so you can easily spot any off moments or trends in your batch. Setting up regular data logs after each brewing cycle can reveal subtle shifts, helping you know when a tweak is due.
Keeping sensors properly calibrated is just as important for consistent data. In plain terms, dear friend, calibration means checking and adjusting the sensor so it reads right, aim for every 100 brew cycles or weekly, whichever comes first. Be mindful of sensor drift; even a small 2°C change over 50 cycles can skew your numbers. Studies suggest a monthly cross-check using a known weight to confirm accuracy. Following these steps helps you catch any changes early, ensuring every data point you log tells the real story of your brew.
Analytical Tools and Software for Post-Brew Diagnostics

Using post-brew software gives you a clear look at how your coffee is coming out. It’s like having a helpful buddy that spots even tiny changes in your brew. Automated reports and smart tools turn every cup into a chance to get even better.
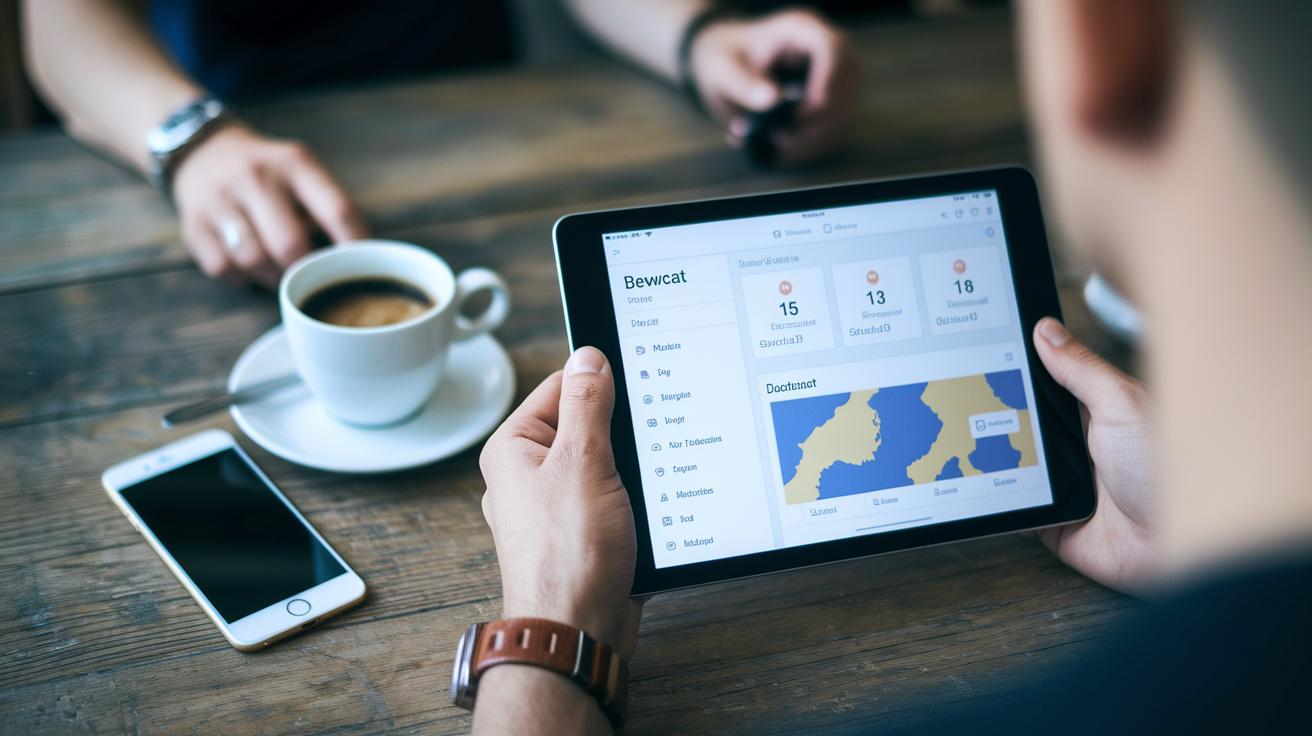
Digital coffee analytics and data visualization tools tap into smart sensors (these are little devices that check things like temperature) to spot trends and surprises in your process. For example, BrewCat keeps track of details like grind size and water temperature, then offers computer-powered suggestions to tighten up your recipe. This makes fixing issues easier and even helps if you’re brewing at home or in a busy café.
| Tool | Key Feature | Best Suited For |
|---|---|---|
| BrewCat | AI-driven brew recommendations | Home brewers & small shops |
| SCADA Platform | Real-time sensor integration | Large commercial roasteries |
| Custom Scripts | Flexible data modeling | Data-science teams |
Choosing the right tool really depends on your setup and budget. Smaller operations might love BrewCat for its easy-to-use, AI-powered approach. Bigger facilities or commercial roasteries might find a SCADA platform perfect since it offers live updates and looks at past trends. And if you’re on a data team that wants to get creative, custom scripts let you adjust everything to fit your needs. Keep your goals in mind and think about both today’s needs and tomorrow’s growth to pick the best tool for your post-brew checks.
Operational Feedback Loops in Post-Brew Data for Process Adjustments
Start a cycle that not only fixes today’s hiccups but also builds a clear picture of how your brew holds up over time. Instead of rehashing old tricks, let this cycle help you spot shifts with simple trend checks and smart sensor readings (these are tools that scan your brew’s vibe, like a temperature check in plain words).
- Right after brewing, jot down the key numbers like TDS, extraction yield, and brew time. Think of it like snapping a quick photo of your brew’s details, this helps catch any sudden changes.
- Compare these numbers to your target values and look for patterns over time. Ever notice how a small drift in extraction yield might hint at a bigger trend? A chart over ten brews can really highlight those subtle shifts.
- Tweak your grind size or water temperature based on what you see. For example, if you notice the TDS is lower than it should be, try a slightly finer grind or nudge the temperature up a bit.
- Update your brewing setup with these fine-tuned settings and keep tracking each change alongside your sensor data. This way, every adjustment adds a layer of clarity to your brew’s performance story.
- Review your results after about ten brews to spot steady improvements or any emerging issues. This regular check-in helps you stay ahead of any brewing surprises.
Best practices for this process?
- Keep a record of every change so you can see the full picture over time.
- Use simple stats, like plotting your key numbers, to decide your next move.
- Always compare your sensor insights with your brewing goals to fine-tune the process as you go.
Case Study: Scaling Coffee Quality with Post-Brew Data Analysis
A small café chain decided to take control of its brew quality by checking key data right after each cup was made. They monitored essential numbers like TDS levels and extraction yield over eight weeks in four locations. Using a smart logging tool called BrewCat, they tracked real-time measurements as each batch was brewed, then compared these numbers to their ideal targets. This allowed them to make quick, smart fixes from afar.
At first, they noticed a 4.5% difference in extraction yield from one shop to another, leading to varying taste notes in their coffee. Monthly reports showed that inconsistent roast profiles were upsetting the balance in flavor. The team started to standardize their process and slowly began to see improvement. Simple changes like tweaking grind settings and water temperatures made a big difference.
Soon, their hard work paid off. The extraction yield variance dropped to just 1.2%, bringing a more consistent flavor to every cup. Customer complaints dropped by 30%, proving that small, well-measured adjustments can really enhance quality.
In the end, this case shows that careful data tracking and analysis can help teams quickly find and fix problems. By using regular trend reports and comparing batches side-by-side, any café can serve up consistent, tasty coffee every time.
Final Words
In the action, we explored sensor calibration, precise brew metrics, and feedback loops that sharpen each cup. We looked at key data points, TDS, extraction yield, and brew time, that guide smart decisions for adjusting recipes. Our chat also covered AI-driven tools like BrewCat that convert raw data into practical tweaks for quality, keeping every brew just right.
By analyzing post-brew data for continuous coffee improvement, every step brings us closer to that perfect, uplifting cup. Enjoy refining your brewing process!
FAQ
What is a coffee brewing control chart PDF?
The coffee brewing control chart PDF refers to a detailed guide that tracks key metrics like extraction and TDS. It helps baristas make quick adjustments for more consistent and balanced brews.
What is the SCA Coffee Brewing Control Chart?
The SCA Coffee Brewing Control Chart is a guideline outlining brewing parameters such as temperature, brew time, and extraction yield. It assists in consistently producing quality coffee, as recommended by the Specialty Coffee Association.
What does an espresso brewing control chart show?
The espresso brewing control chart shows vital metrics like extraction yield, brew time, and water temperature. By monitoring these numbers, baristas can perfect every espresso shot for optimal flavor and balance.
What is the 80/20 rule for coffee?
The 80/20 rule for coffee suggests that 80% of a cup’s flavor comes from 20% of the brewing parameters. It prompts brewers to focus on fine-tuning the most influential aspects, such as grind and water temperature.
What is the 15 15 15 rule for coffee?
The 15 15 15 rule for coffee advises using 15 grams of coffee, 15 ounces of water, and allowing a 15-second bloom. This guideline helps to keep flavor extraction balanced and the brew consistently enjoyable.
What are the key variables in coffee processing that contribute most to quality?
Key variables in coffee processing include grind size, water temperature, extraction yield, and brew time. These factors play a major role in shaping a brew’s flavor profile and overall quality.
What do TDS and PE represent in coffee?
TDS represents total dissolved solids, which measure the coffee’s concentration, while PE indicates the extraction yield percentage. Both values are crucial in assessing and optimizing the strength and flavor balance of a brew.
What is a coffee extraction calculator and how is it used?
A coffee extraction calculator is a tool that computes the extraction yield and concentration (TDS) based on brewing data. It lets brewers adjust their recipes to ensure a perfect balance of flavor and strength.
What is a coffee brewing journal and why is it beneficial?
A coffee brewing journal is a log where brewers record data like grind size, water temperature, and brew time. It helps track trends over time, making it easier to adjust recipes for improved coffee consistency.