
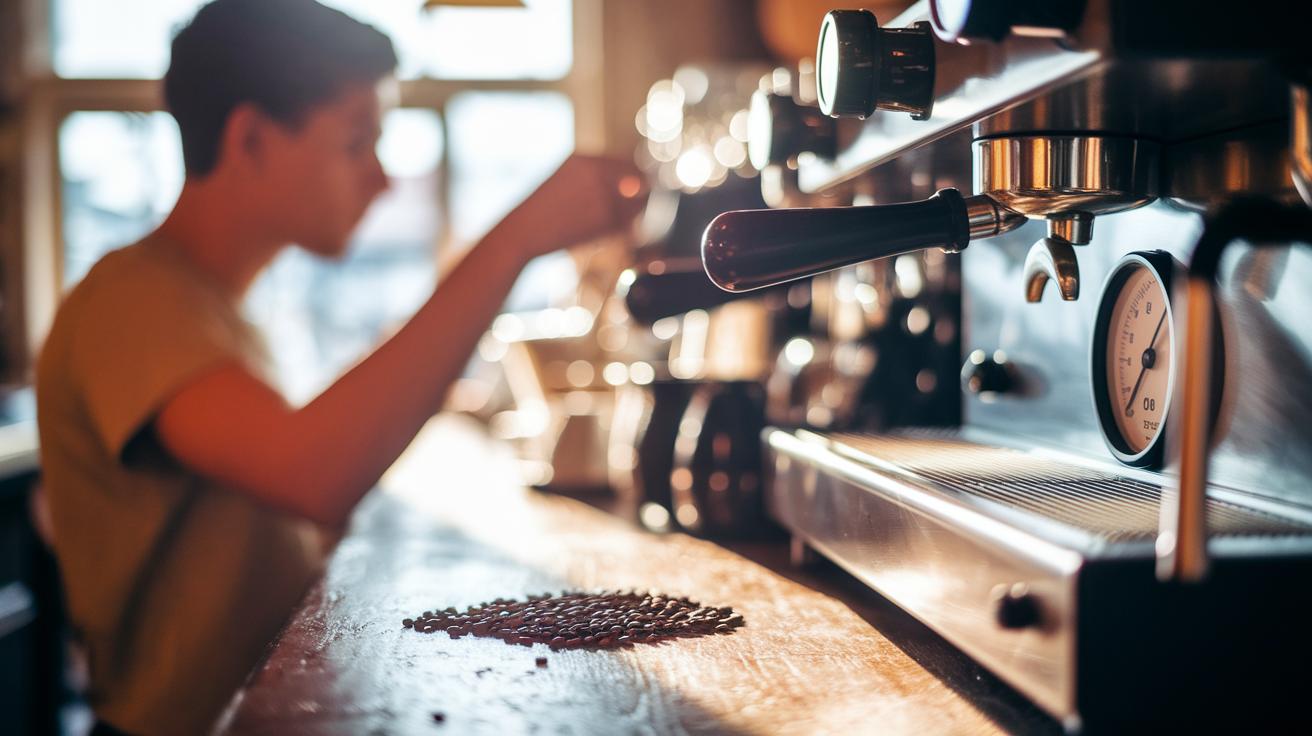
Ever wonder why your espresso might not taste quite right, even when you use the same routine? It could be due to the pressure readings from your machine. When you check the pressure curve, you can see how water meets coffee at every stage, from the gentle pre-infusion to the strong plateau. This post walks you through each step and shows you simple tips to adjust your brew. Soon, your daily espresso will feel like a steady, refreshing ritual.
Achieving Flavor Consistency by Interpreting Espresso Pressure Profile Data
When you look at espresso pressure data, you’re really turning your brew routine into a reliable recipe for great flavor. The pressure readings break down the process into four simple steps.
First, there’s the pre-infusion stage. Here, the pressure sits between 1 and 4 bars, gently waking up the coffee grounds, kind of like wetting a sponge before you start cleaning. This step makes sure the coffee puck is ready for everything that comes next.
Then, you move into the ramp-up stage. Gradually, the pressure climbs toward about 9 bars. This slow increase lets water seep evenly through the beans, helping their flavors bloom slowly. The idea is pretty straightforward: think of pressure as the push of water against a bit of resistance. As the water extracts the coffee flavors, that resistance shifts, so keeping it flat at 9 bars might miss out on some taste magic.
Once you hit and hold that peak pressure during the plateau stage, that’s when both the light and deeper notes start to show. This pause gives you a richer crema and an overall balanced cup. And finally, during the ramp-down, the pressure eases off gradually, letting you capture the final bursts of flavor.
By keeping a close eye on these pressure curves, it’s easier to spot when a shot might be under-extracted or over-extracted. This hands-on approach helps you tweak the settings so every cup tastes just right. For more on these data-driven coffee brewing insights, check out the link on aboutjoe.com.
Identifying Key Pressure Metrics in Espresso Pressure Profile Data
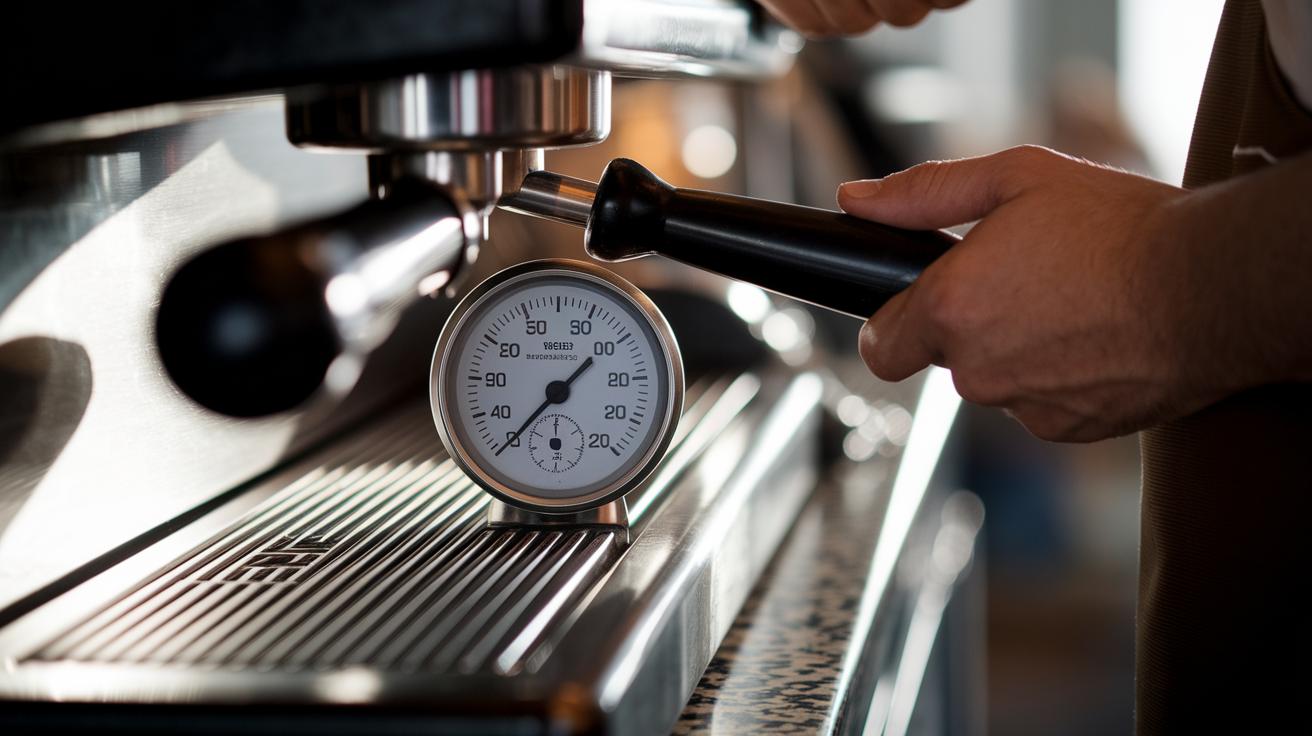
Gauge readings help us see what’s normal and what’s off in your espresso machine’s pressure profile. Instead of rehashing the whole brewing process, let’s chat about two new details: ramp rate and plateau duration.
A ramp rate tells you how fast the pressure builds, kind of like how quickly water meets coffee. For example, if your machine ramps up at 1 bar per second instead of a slower pace, the water might be rushing in too fast. This quick surge can hint at uneven grind consistency or varying tamp pressure.
Plateau duration is the period when the pressure holds steady near its peak. If this phase lasts longer than expected, it may be because the coffee is too finely ground or tamped too hard. Conversely, a shorter plateau could indicate a more open extraction path, possibly changing your final brew.
| Metric | Normal Range | Troubleshooting Tip |
|---|---|---|
| Ramp Rate | 0.5-1 bar/sec | If it’s too fast, check for rapid water flow or uneven grounds. |
| Plateau Duration | Based on machine specs | A longer phase may mean you should adjust your grind size or tamp pressure. |
Monitoring these metrics gives you helpful clues to fix pressure issues and fine-tune your brewing technique.
Applying Curve Analysis Techniques to Pressure Profile Data
When you're diving into pressure data, it all starts by taming those noisy numbers. Think of it like cleaning off a foggy window so you get a clear view. Use a basic software filter or even some simple spreadsheet tricks to smooth out the random pressure blips. This step helps you see the real details in your data without pesky interference.
Next, look for the inflection points in your curve. These are the moments when things shift, like when the process moves from pre-infusion into a steady ramp-up or that calm, plateau stage. Picture it as spotting the exact moment when rising pressure makes an abrupt turn, hinting that water and coffee grounds are starting to interact in a whole new way.
Another neat trick is to measure the ramp slope, which shows you just how quickly pressure builds during extraction. Comparing these slopes from cup to cup can reveal small changes that might be due to tweaks in your grinder settings or tamping technique. You can easily grab your spreadsheet again to calculate the area under the curve, a step that can tell you how long your coffee stays in that perfect extraction zone.
Finally, keep a close eye on those key numbers, inflection points, ramp slopes, and curve areas, and note any shifts over time. This method gives you practical insights that let you fine-tune your brewing process, ensuring every cup delivers a balanced and delightful flavor.
Calibrating Espresso Machines for Reliable Pressure Profile Data
Think of calibrating your espresso machine like tuning a favorite instrument, it helps your coffee hit all the right notes. Start by checking your machine’s gauge with a manometer, which is just a simple tool to make sure the sensor readings are true. You want every shot to show the right balance of water flow and coffee resistance.
Next, adjust the pre-infusion pressure so the grounds wake up gently between 1 and 4 bars. Then, set the pressure to build at roughly 1 bar per second until it reaches a peak of about 9 bars with a steady hold, ensuring you get the best flavor extraction in every cup.
Some machines, like the Lelit Bianca or Torre Peppina Evo, come with cool sensor features that make this whole process a breeze. They even help you catch little changes in pump performance or sensor drift, almost like having a built-in coffee expert. For more on smart coffee brewing technology, visit https://aboutjoe.com?p=85.
Below is a handy checklist to keep your espresso machine in top shape:
| Parameter | Target Value | Tool | Check Frequency |
|---|---|---|---|
| Pre-infusion pressure | 1–4 bars | Manometer | Weekly |
| Ramp rate | 1 bar/sec | Software log | Monthly |
| Peak pressure | ~9 bars | Gauge | Daily |
| Ramp-down curve | Controlled decline | Data logger | Weekly |
Regular calibration makes sure every cup is balanced and full of flavor, a comforting routine that pays off shot after shot.
Data‐Driven Brew Adjustments for Uniform Espresso Flavor
Start by jotting down every detail of your brew using a scale and timer. For example, you might note, “I extracted 35 grams in 28 seconds,” and record how the pressure curve behaved during the process. This simple data becomes your starting point, letting you compare actual numbers to your ideal flavor targets. Also, scribble down your tasting notes, whether the cup was a bit too bitter or just right, as these clues help when you adjust the machine by tweaking the ramp-up in 0.5-bar steps.
Next, try different settings one shot at a time. If you find that a shot tastes a little sour with a shorter ramp-up period, extend the ramp by 0.5 bars and see what happens. Write down every change so you can track your progress and see which adjustments lead to a more consistent flavor across your brews.
Work through the process step by step. Record details like yield, extraction time, and subtle shifts in the pressure curve, along with your observations on sweetness, body, and the crema’s texture. Over time, these careful trials help build a balanced profile that consistently meets your flavor targets. Keep testing, noting your results, and refining the process until every espresso shot delivers that dependable, satisfying flavor.
Final Words
in the action, we explored how reading each stage of the pressure curve sets the foundation for a consistent, delicious cup. We broke down calibration tips, key metrics, and curve analysis techniques that help pinpoint subtle changes in extraction.
By interpreting espresso pressure profile data for flavor consistency, you gain practical insights to fine-tune every brew. Each adjustment, from pre-infusion pressure to ramp-down curves, makes a measurable difference. Enjoy the process and keep refining your technique for that perfect cup every time.
FAQ
What does interpreting espresso pressure profile data for flavor consistency pdf tell you?
Interpreting espresso pressure profile data shows the four key extraction phases. This helps you track pre-infusion, peak pressure, and ramp stages, which lead to balanced flavor and reduced channeling.
How does a pressure profiling espresso machine work?
A pressure profiling espresso machine controls each stage of extraction, from a gentle pre-infusion to a steady peak, then a controlled ramp-down. This managed pressure results in a more even extraction.
What are the stages of espresso extraction and why are they important?
The extraction stages include a light pre-infusion, ramp-up to about 9 bars, a brief hold, and a ramp-down. Each stage affects how solubles mix, ensuring a richer crema and balanced taste.
What information does an espresso calibration chart provide?
An espresso calibration chart outlines key pressure metrics like pre-infusion levels, peak pressure, ramp rates, and ramp-down curves. This helps fine-tune your machine for consistent flavor.
How fine should espresso be ground for optimal extraction?
The grind should be fine enough to provide sufficient resistance yet not overly compact. This balance helps control the pressure profile and extraction, resulting in a smoother, fuller flavor.
What is the ideal temperature for dark roast espresso?
Dark roast espresso benefits from a slightly lower temperature to prevent over-extraction. This helps maintain a rich, mellow flavor without introducing bitterness.
How does the dose affect espresso flavor and extraction?
The dose influences how water interacts with coffee, affecting pressure and extraction yield. Adjusting the dose can shift resistance, impacting both flavor balance and crema quality.
What is the best temperature for medium roast espresso?
Medium roast espresso typically performs well at a standard brewing temperature that highlights both its sweetness and acidity, offering balanced and full flavor in each shot.