
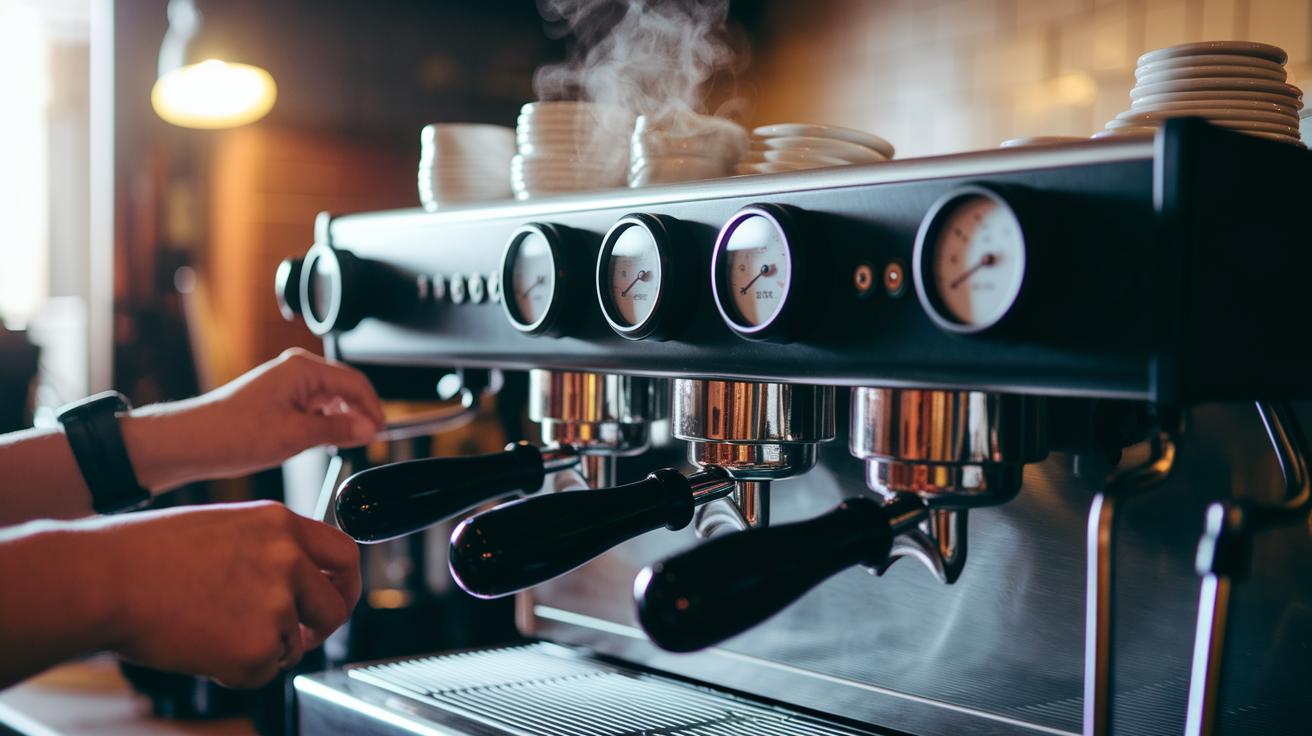
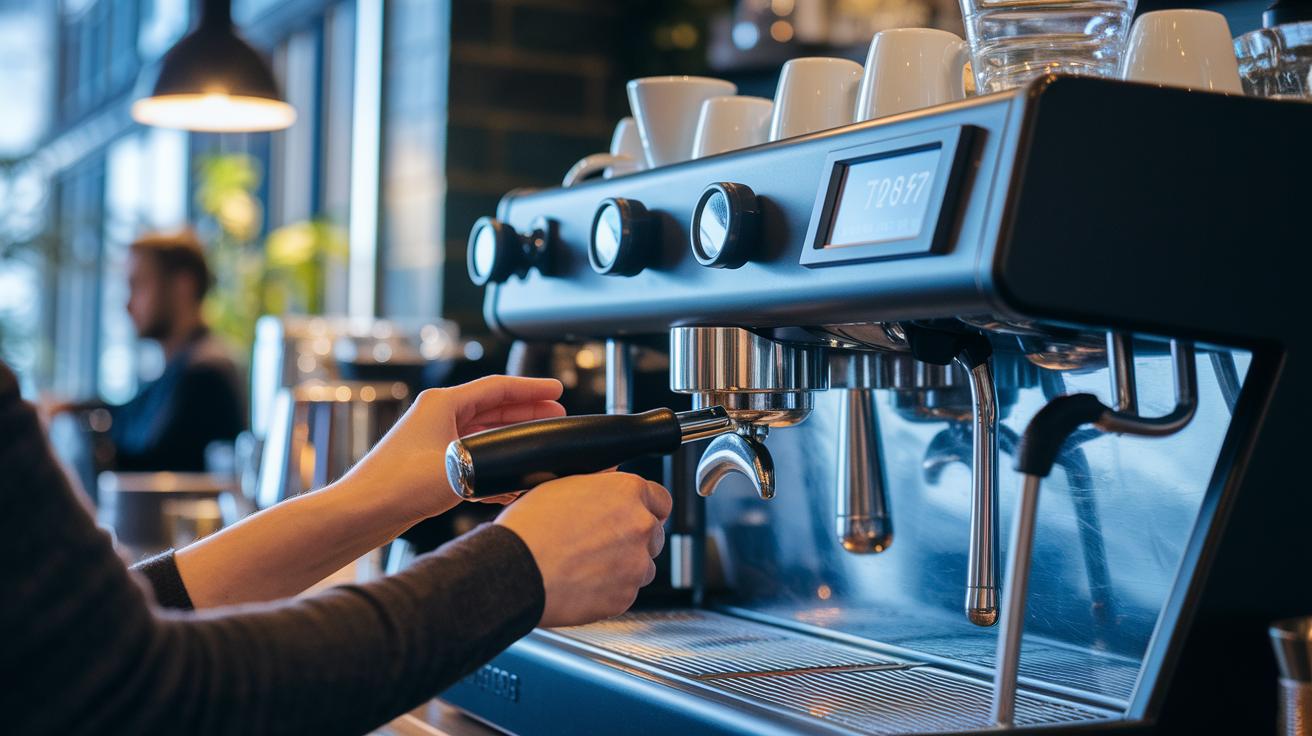
Ever thought your coffee machine might need a little check-up? Keeping an eye on its performance can cut waste by 15% and make every cup taste even better.
Imagine knowing simple numbers like extraction rate (how well the machine pulls flavor), uptime (how long it runs smoothly), and output (the amount of coffee brewed). These figures are like a secret recipe that helps you enjoy a consistently great cup while keeping your gear in top shape.
So, why not take a closer look? You might just discover that your coffee machine is even more awesome than you thought.
Essentials of Evaluating Coffee Equipment Performance with KPIs
Keeping an eye on your coffee equipment’s performance can cut waste by as much as 15%. One important measure is extraction efficiency, which tells you how much of the coffee’s good stuff is dissolved in every cup. When your brew falls between an 18 and 22 percent yield, you know it has that perfect flavor balance. Think of a sensor-driven system as a smart helper, it checks things like temperature and pressure continuously and tweaks the water-to-coffee ratio so you stay right on track.
Another key number is uptime. You want your machine working more than 95% of the time so you don’t face delays or any hiccups that might change your coffee’s consistent taste. And then there's the throughput rate. This tells you how many cups you can pull in an hour. For batch brewers, a solid range is somewhere between 60 and 120 cups per hour, keeping the flow steady without cutting corners on quality.
Don’t forget maintenance turnaround time. A target of under 4 hours means your gear spends less time being fixed and more time brewing your perfect cup. And to top it all off, keeping temperature and pressure stable, usually within plus or minus 1 °C and 0.2 bar, ensures each cup tastes exactly as it should.
All these performance metrics fall into five main categories: efficiency, reliability, quality, utilization, and cost. By tracking these numbers, equipment managers can make smart decisions to keep machines running their best, letting you enjoy every single cup to its fullest potential.
Brewing Efficiency Analysis for Coffee Equipment

Brewing efficiency tells us how well coffee gear pulls all those tasty compounds from the beans. It comes down to the percentage of dissolved solids, and the sweet spot is between 18 and 22 percent. Modern machines even use sensors to keep an eye on these solids, making sure every cycle stays within a tiny 0.5 percent change. Picture it like each cup getting its own flavor fingerprint.
Throughput is another key measure of a machine’s performance. For batch brewers, that means making around 60 to 120 cups every hour. Espresso machines, on the other hand, typically churn out about 40 to 60 cups per hour. Both types use sensor data to fine-tune their settings, ensuring every coffee comes out just right.
| System Type | Throughput (cups per hour) |
|---|---|
| Batch Brewer | 60–120 |
| Espresso Machine | 40–60 |
Tracking Reliability and Uptime Metrics in Coffee Machines
Your coffee gear’s top performance is built on a few key reliability numbers. Your machine should be active and brewing more than 95% of the time, and a mean time between failures of over 1,000 hours means fewer interruptions. In simple terms, keeping repairs to less than twice a month and setting service downtime under 2% ensures every cup feels just as perfect as the last.
Here's an interesting note, a machine with only 2% downtime rarely leaves a coffee lover disappointed on a busy morning. With real-time telemetry, your equipment manager can catch any small issues before they become big problems. Sensors keep an eye on things like temperature and pressure (think of them as little coffee critics), so when something’s off, you get an alert right away. This smart setup can cut unplanned downtime by roughly 30%.
Let’s break down the targets:
| Metric | Goal |
|---|---|
| Uptime (%) | Over 95% |
| MTBF | More than 1,000 hours |
| Repair Frequency | Less than 2 per month |
| Service Downtime | Below 2% of operating hours |
Using these methods to track uptime and system reliability means your coffee machine runs smoothly every day. And doesn’t it feel great knowing that modern technology is helping to keep your morning brew perfect from start to finish?
5 key performance indicators for coffee equipment shine
When it comes to a perfect cup, temperature is the star. A good coffee machine keeps the heat steady within plus or minus 1°C. Sensors check the temperature every few seconds, so even tiny changes don't go unnoticed.
Pressure plays a big role too. Think of it as the heartbeat of your brew. A sensor makes sure the pressure stays within plus or minus 0.2 bar, ensuring each extraction brings out a balanced flavor you can feel in every sip.
Water quality is another key player. Keeping the water's pH between 6.5 and 7.5 helps stop issues like scale buildup or weird off-tastes. Digital sensors monitor this in real time, so you know your coffee is brewed with care.
Then there’s the composite brewing consistency index. This index mixes flow rate, temperature, and pressure into one simple score of quality. When all these elements work in harmony, every cup meets high standards, like a perfectly tuned symphony of flavors.
Lastly, a daily cleaning routine can boost consistency by reducing variability by about 10 percent. Regular checks, like a weekly sensor calibration and daily backflushing, make sure everything runs smoothly. It's like giving your machine a little daily pep talk to keep it at its best.
Cost Efficiency and Maintenance Benchmarks for Coffee Equipment
When you’re thinking about spending on coffee gear, watching costs is as important as nailing that perfect brew. A great place to start is by checking the energy use, this tells you how many kilowatt-hours (kWh, or units of energy) your machine needs to make 1,000 cups. Keeping it under 15 kWh means you save money and help the planet.
Next up is looking at maintenance costs. Ideally, your machine shouldn’t cost more than 50 cents per hour to run. This way, you can spend less on repairs and more on enjoying that tasty coffee. Plus, if each cup costs less than 5 cents to make, you’re keeping your brews both budget-friendly and delicious.
Another big piece is planning for the long run. By spreading out the cost of your equipment over a five-year period, you can better manage upgrades and long-term expenses. This simple plan helps keep your budget in check while making sure you get the most out of your coffee maker.
And don’t forget regular check-ups. Smart sensors, little devices that tell you when it’s time to service the machine, can make maintenance a breeze. Following a good maintenance schedule can even cut repair costs by about 20%, so your equipment stays in perfect shape, ready to serve up that satisfying cup every time.
Designing Digital Dashboards and Data Logging for Coffee Equipment KPIs
Keeping a close eye on your coffee equipment's performance is key. Digital monitoring gives you real-time insights into what matters most. Today's systems blend sensors for TDS (which checks how much is dissolved in your brew), temperature, and flow, logging data every single second. Imagine a live dashboard that pops an alert if readings drift more than 5 percent above or below the target. It’s just like having a careful assistant making sure every cup is spot on.
When you set up your KPI dashboard, try using communication methods like MQTT or OPC-UA. These choices let data flow smoothly, kind of like water through a well-tuned espresso machine. They keep updates steady and connect to systems that store a full year of history, making audits feel simple and helping you make smart decisions.
Sensor placement and calibration are also key. Accurate readings form the backbone of reliable monitoring. Regular checks help you keep track of things in real time and catch emerging trends before they become a problem. Think of it as creating a lively control center for your coffee gear.
A great dashboard shows clear, live charts that refresh in real time along with alerts that gently call you to action when something feels off. With sensor data logged every second, you get the details needed for proactive maintenance and smooth daily operations. By following these digital monitoring standards, you easily transform raw numbers into smart, everyday insights that keep your coffee equipment on point.
Applying KPI Insights to Optimize Coffee Equipment Performance
Think of your KPI data as a friendly guide that helps you keep your coffee machine in top shape. Start by setting clear benchmarks so you can see how your equipment stacks up against industry standards, like checking if your brewer is keeping pace with the best. When numbers start drifting, simple charts can show you trends, almost like a little mood ring for your machine’s health. For example, if you see that extraction variance is slowly climbing, set a goal to reduce it by 10% each year.
Another great trick is using AI-driven predictive maintenance. Imagine your machine giving you a gentle nudge when a vibration goes above 3 mm/s, hinting that something might be off. This isn’t just a warning, it’s a helpful signal to check things out before the brew quality suffers. It turns fixing problems into a smooth, proactive routine rather than a last-minute scramble.
It’s also smart to compare your gear’s performance with industry benchmarks regularly. By looking at numbers like temperature stability, extraction yield, and throughput side by side, you get a clear picture of your machine’s strengths and areas for improvement. This constant check helps you spot tiny changes and encourages gradual tweaks that boost quality and reliability.
Finally, use these insights to create clear, actionable plans. Make a list of areas needing improvement, schedule regular check-ups, and use simple charts to track your progress over time. In short, letting your KPI data steer your maintenance plans can help you keep that perfect extraction spot just where it needs to be.
Final Words
In the action, we looked at how smart systems and sensor-driven insights guide every brew. We broke down extraction yield, uptime, brewing consistency, and even cost efficiency into clear, trackable numbers. Our discussion illuminated how digital dashboards and real-time data help keep your machine at its best. Applying these key performance indicators for coffee equipment can lead to more consistent, delicious cups every time. Enjoy the fresh, optimized flavor that comes with every well-managed brew.
FAQ
What are the key performance indicators for coffee equipment template?
The key performance indicators for coffee equipment template include extraction efficiency, uptime, throughput rate, maintenance turnaround time, and stability of temperature and pressure. These metrics help monitor equipment performance precisely.
What are KPIs for coffee shops or a cafe?
The KPIs for coffee shops and cafes measure sales, customer satisfaction, operational uptime, efficiency, and cost per cup. They offer a clear view of operations and pinpoint areas to boost service and profits.
What does KPI mean?
KPI stands for Key Performance Indicator. It describes a measurable value that shows how effectively an operation meets key business objectives, guiding improvements in efficiency and quality.
How do KPIs apply to a barista’s performance?
KPIs applied to baristas track drink quality, preparation speed, and customer feedback. Monitoring these indicators helps assess individual performance and supports targeted training for better service.
What should a coffee shop sales dashboard display?
A coffee shop sales dashboard displays real-time revenue, popular items, inventory levels, and overall sales trends. These insights help managers make quick decisions to improve profitability and service quality.
Which coffee publications discuss coffee equipment KPIs?
Coffee publications often discuss equipment KPIs, showcasing industry benchmarks, equipment reviews, and maintenance tips. Readers gain practical insights into performance metrics that drive better brewing and overall operations.
What are the top five KPIs and key metrics for measuring performance?
The top five KPIs typically include efficiency, reliability, quality, utilization, and cost. These metrics offer a comprehensive view of operations, helping reduce waste, improve service, and enhance profit margins.
What are the four P’s of KPI?
The four P’s of KPI refer to performance, process, product, and profit. They outline the key areas to monitor, ensuring a balanced evaluation of operational effectiveness and overall business health.